How to use the B-Star Pipeline
1. Click B-Star Pipeline (either the top menu or the button).
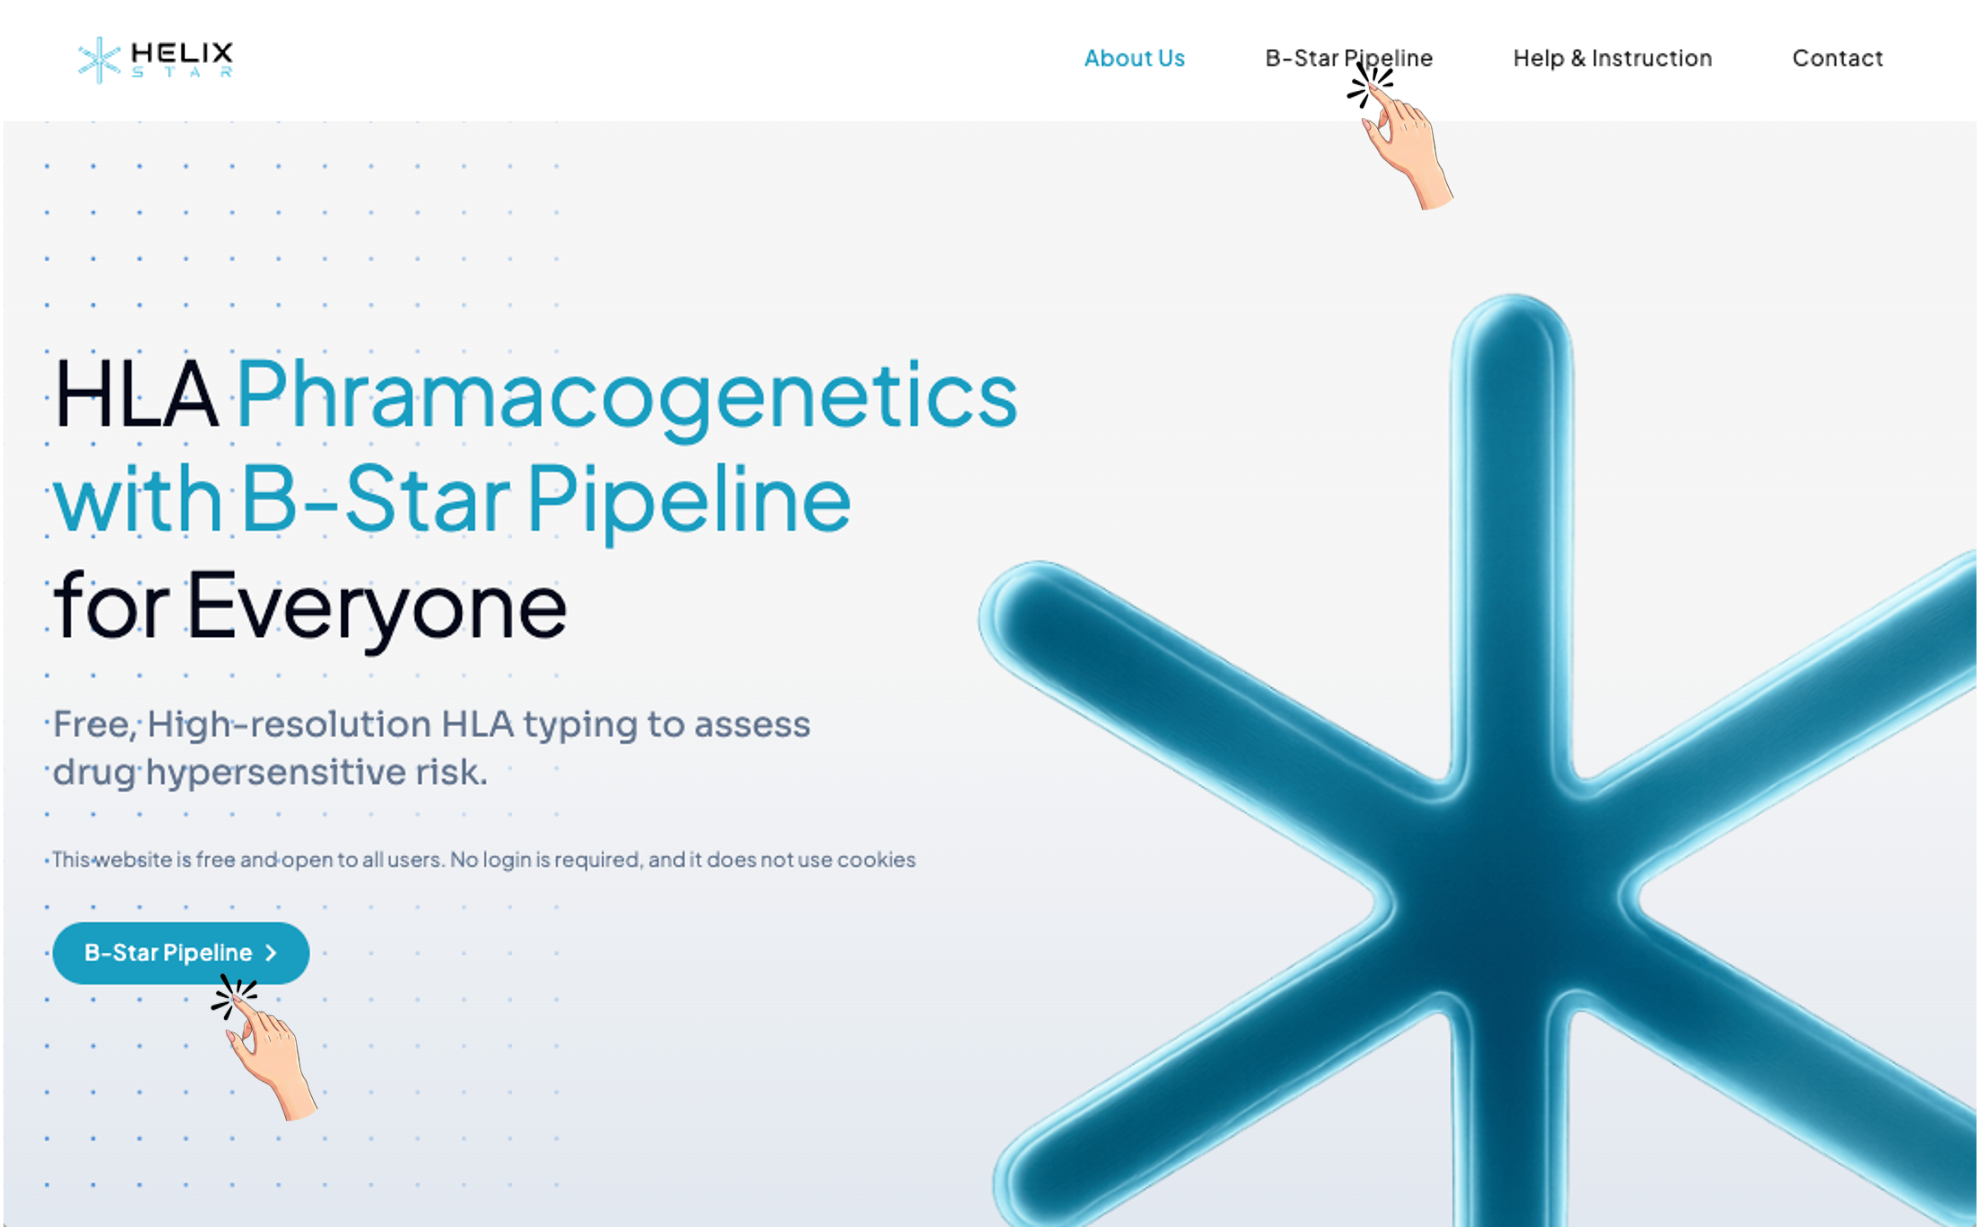
2. B-Start Pipeline workflow overview
After clicking B-Star Pipeline, the page guides the user through 3 main steps:
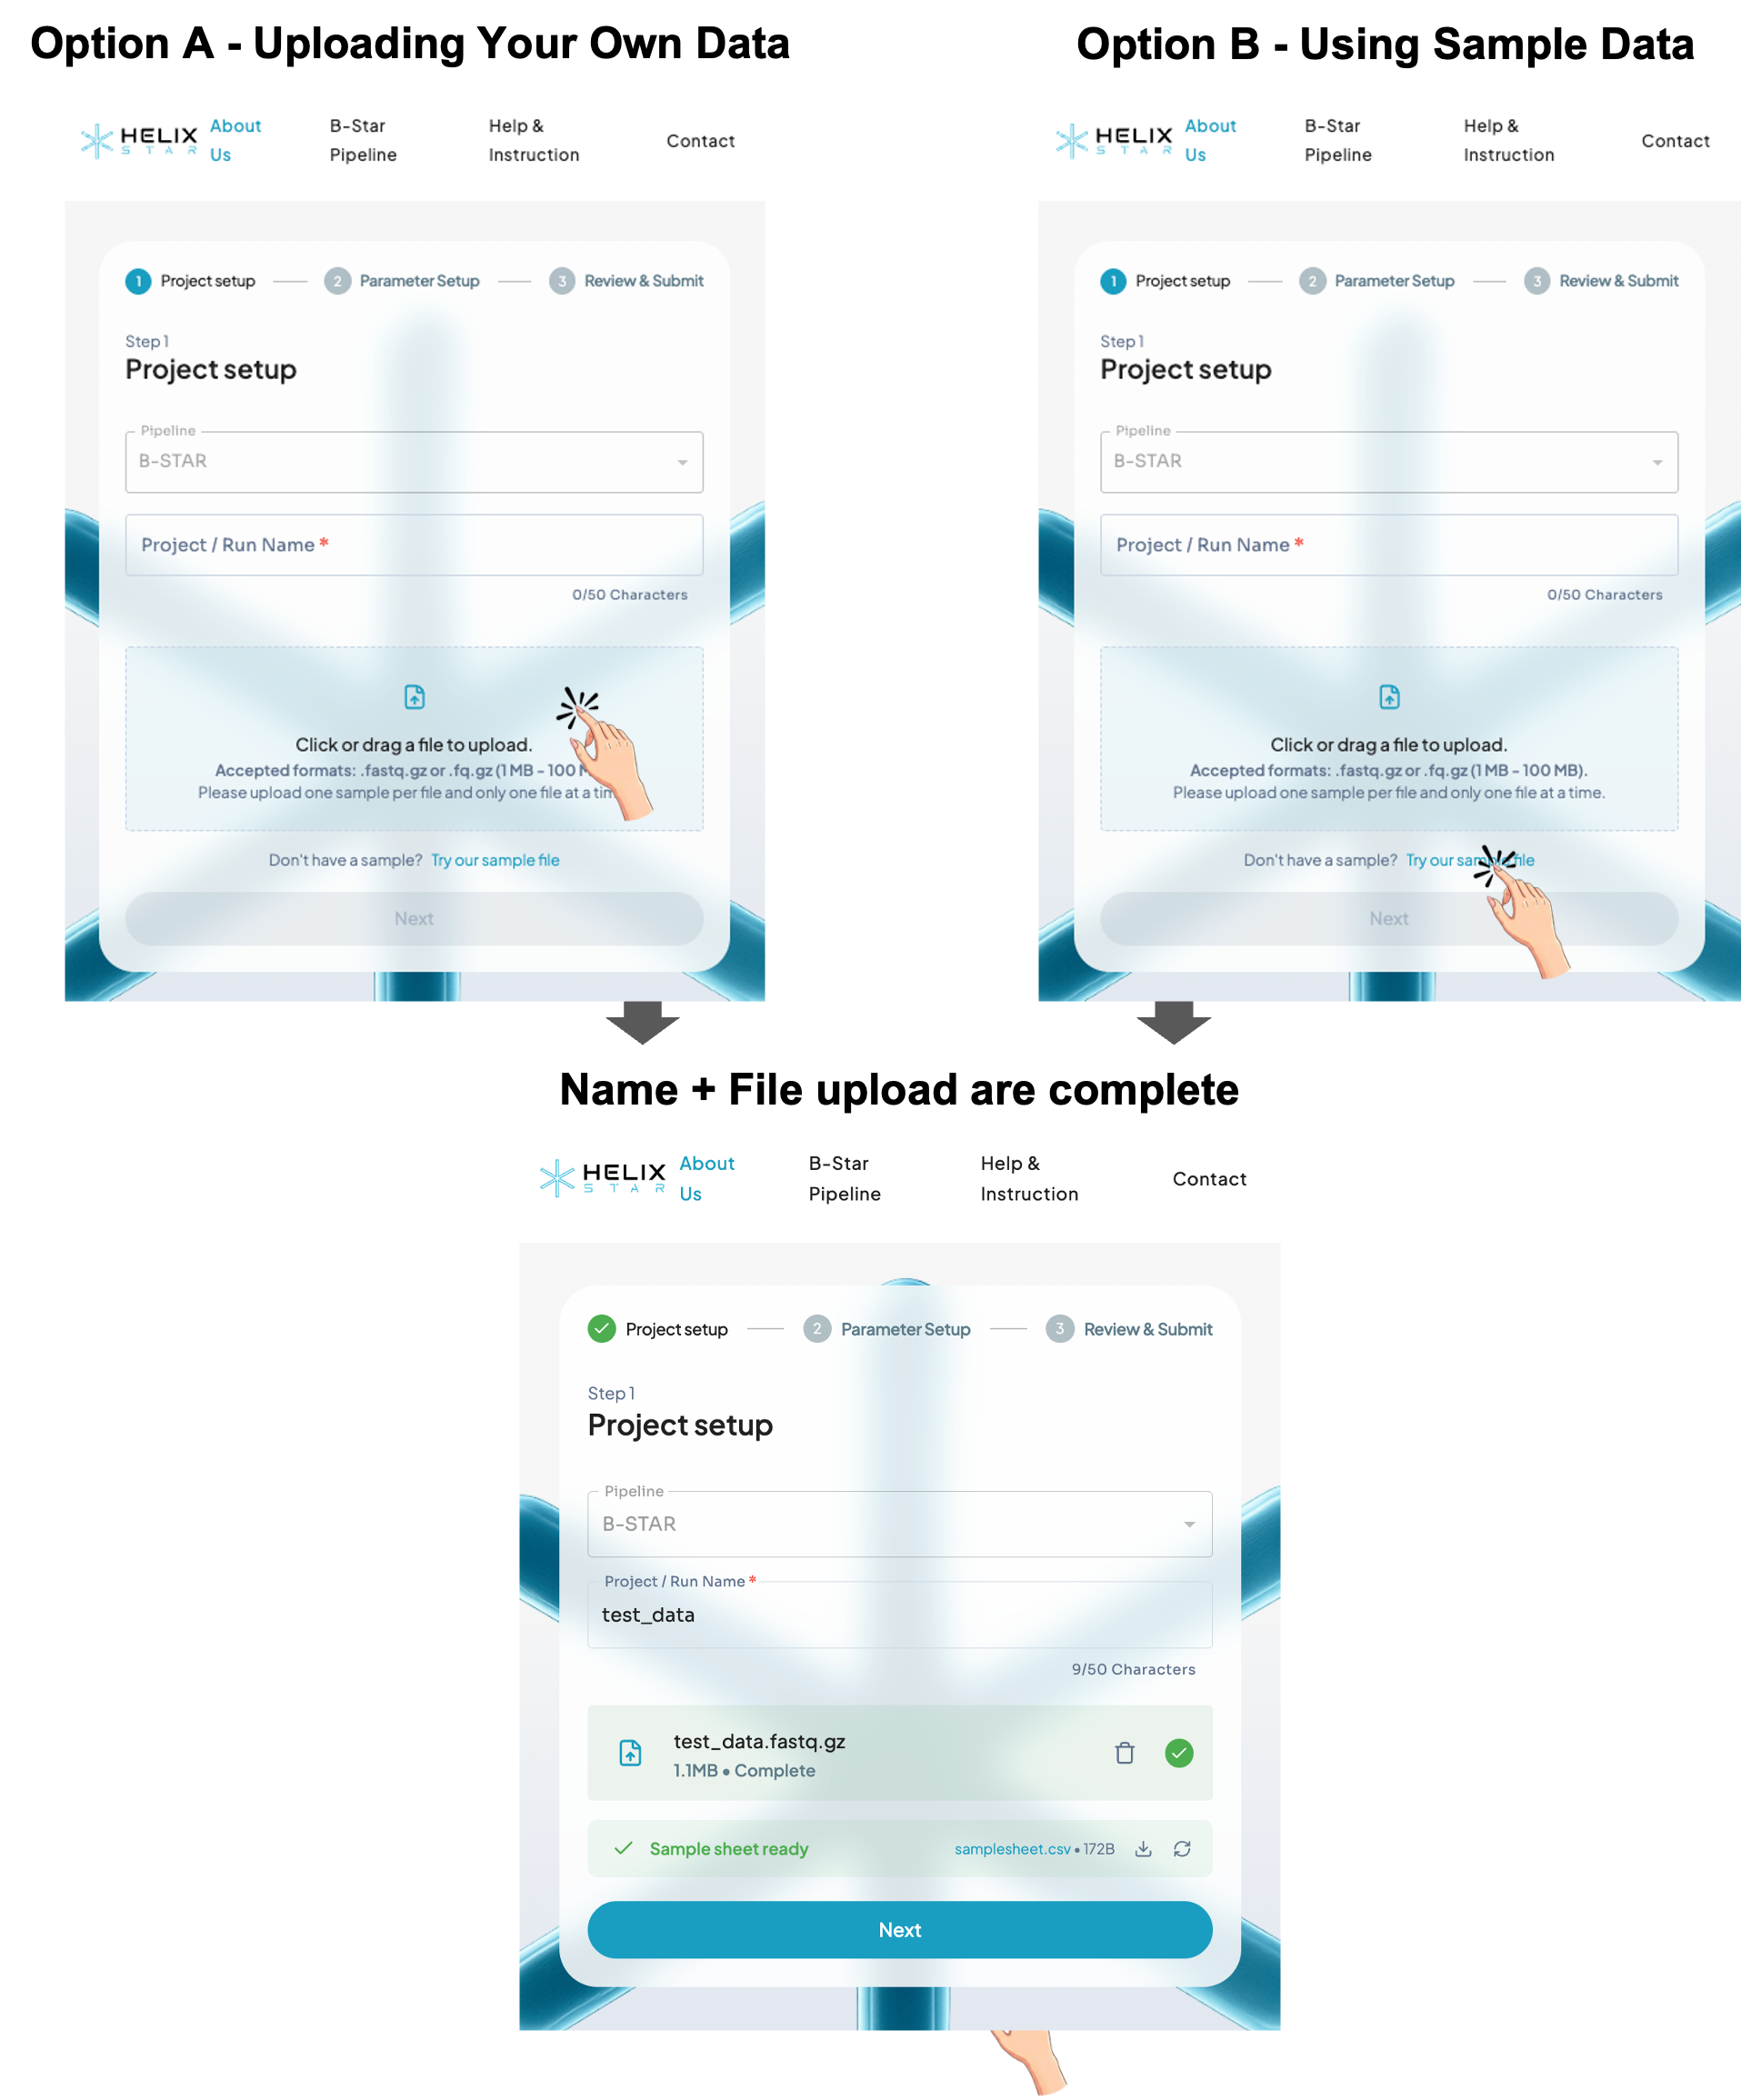
Step 1: Project setup
This step is for naming your run and uploading your sequencing file.
- Project / Run Name (required): type a short name (max 50 characters), e.g. Sample01.
- Upload file (Option A): click or drag-and-drop one file.
- Accepted: compressed FASTQ files including ".fastq.gz" and "fq.gz"
- File size: 20–300 MB
- If you don't have data, click "Try our sample file" (Option B) to test.
- When name + file upload are complete, the Next button becomes active.
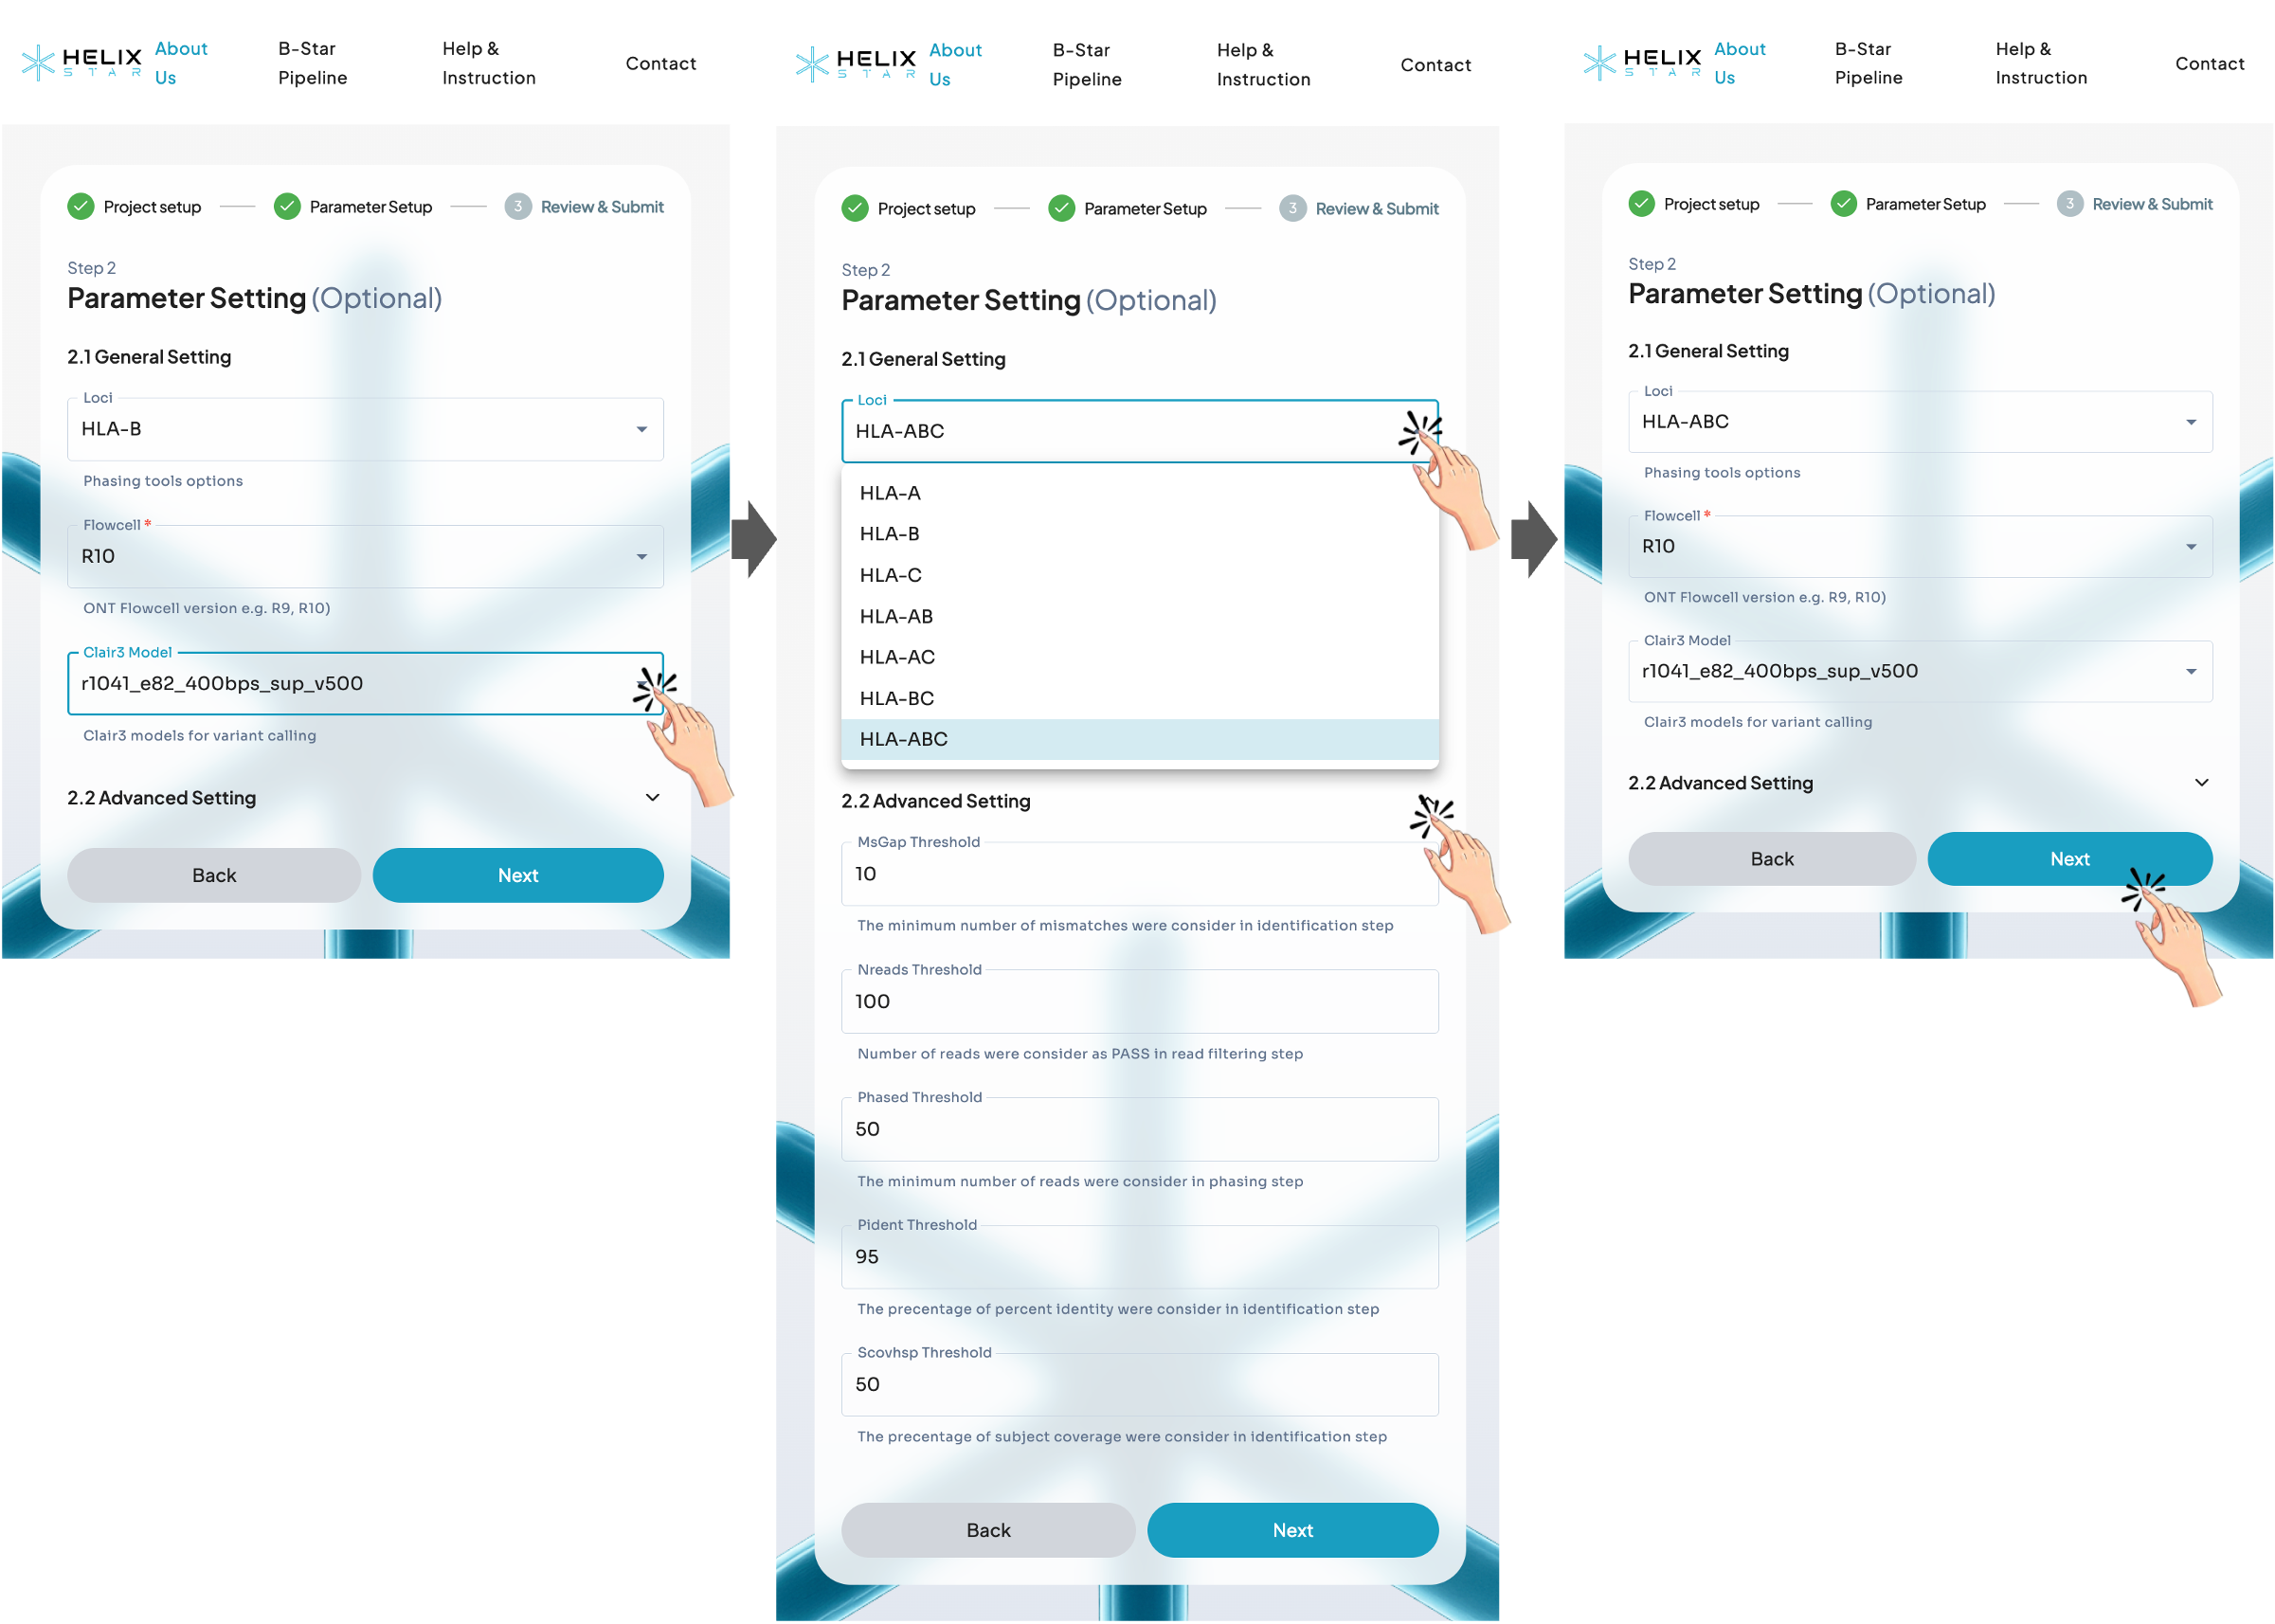
Step 2: Configuration
In this step, users select the HLA locus to match their PCR product (e.g., HLA-A, HLA-B, HLA-C, or combined options such as HLA-AB/AC/BC/ABC). Next, confirm the Flowcell type and make sure the Clair3 model matches the basecalling model used (or choose the closest available option). Advanced thresholds can usually be left as default, then click Next to continue.
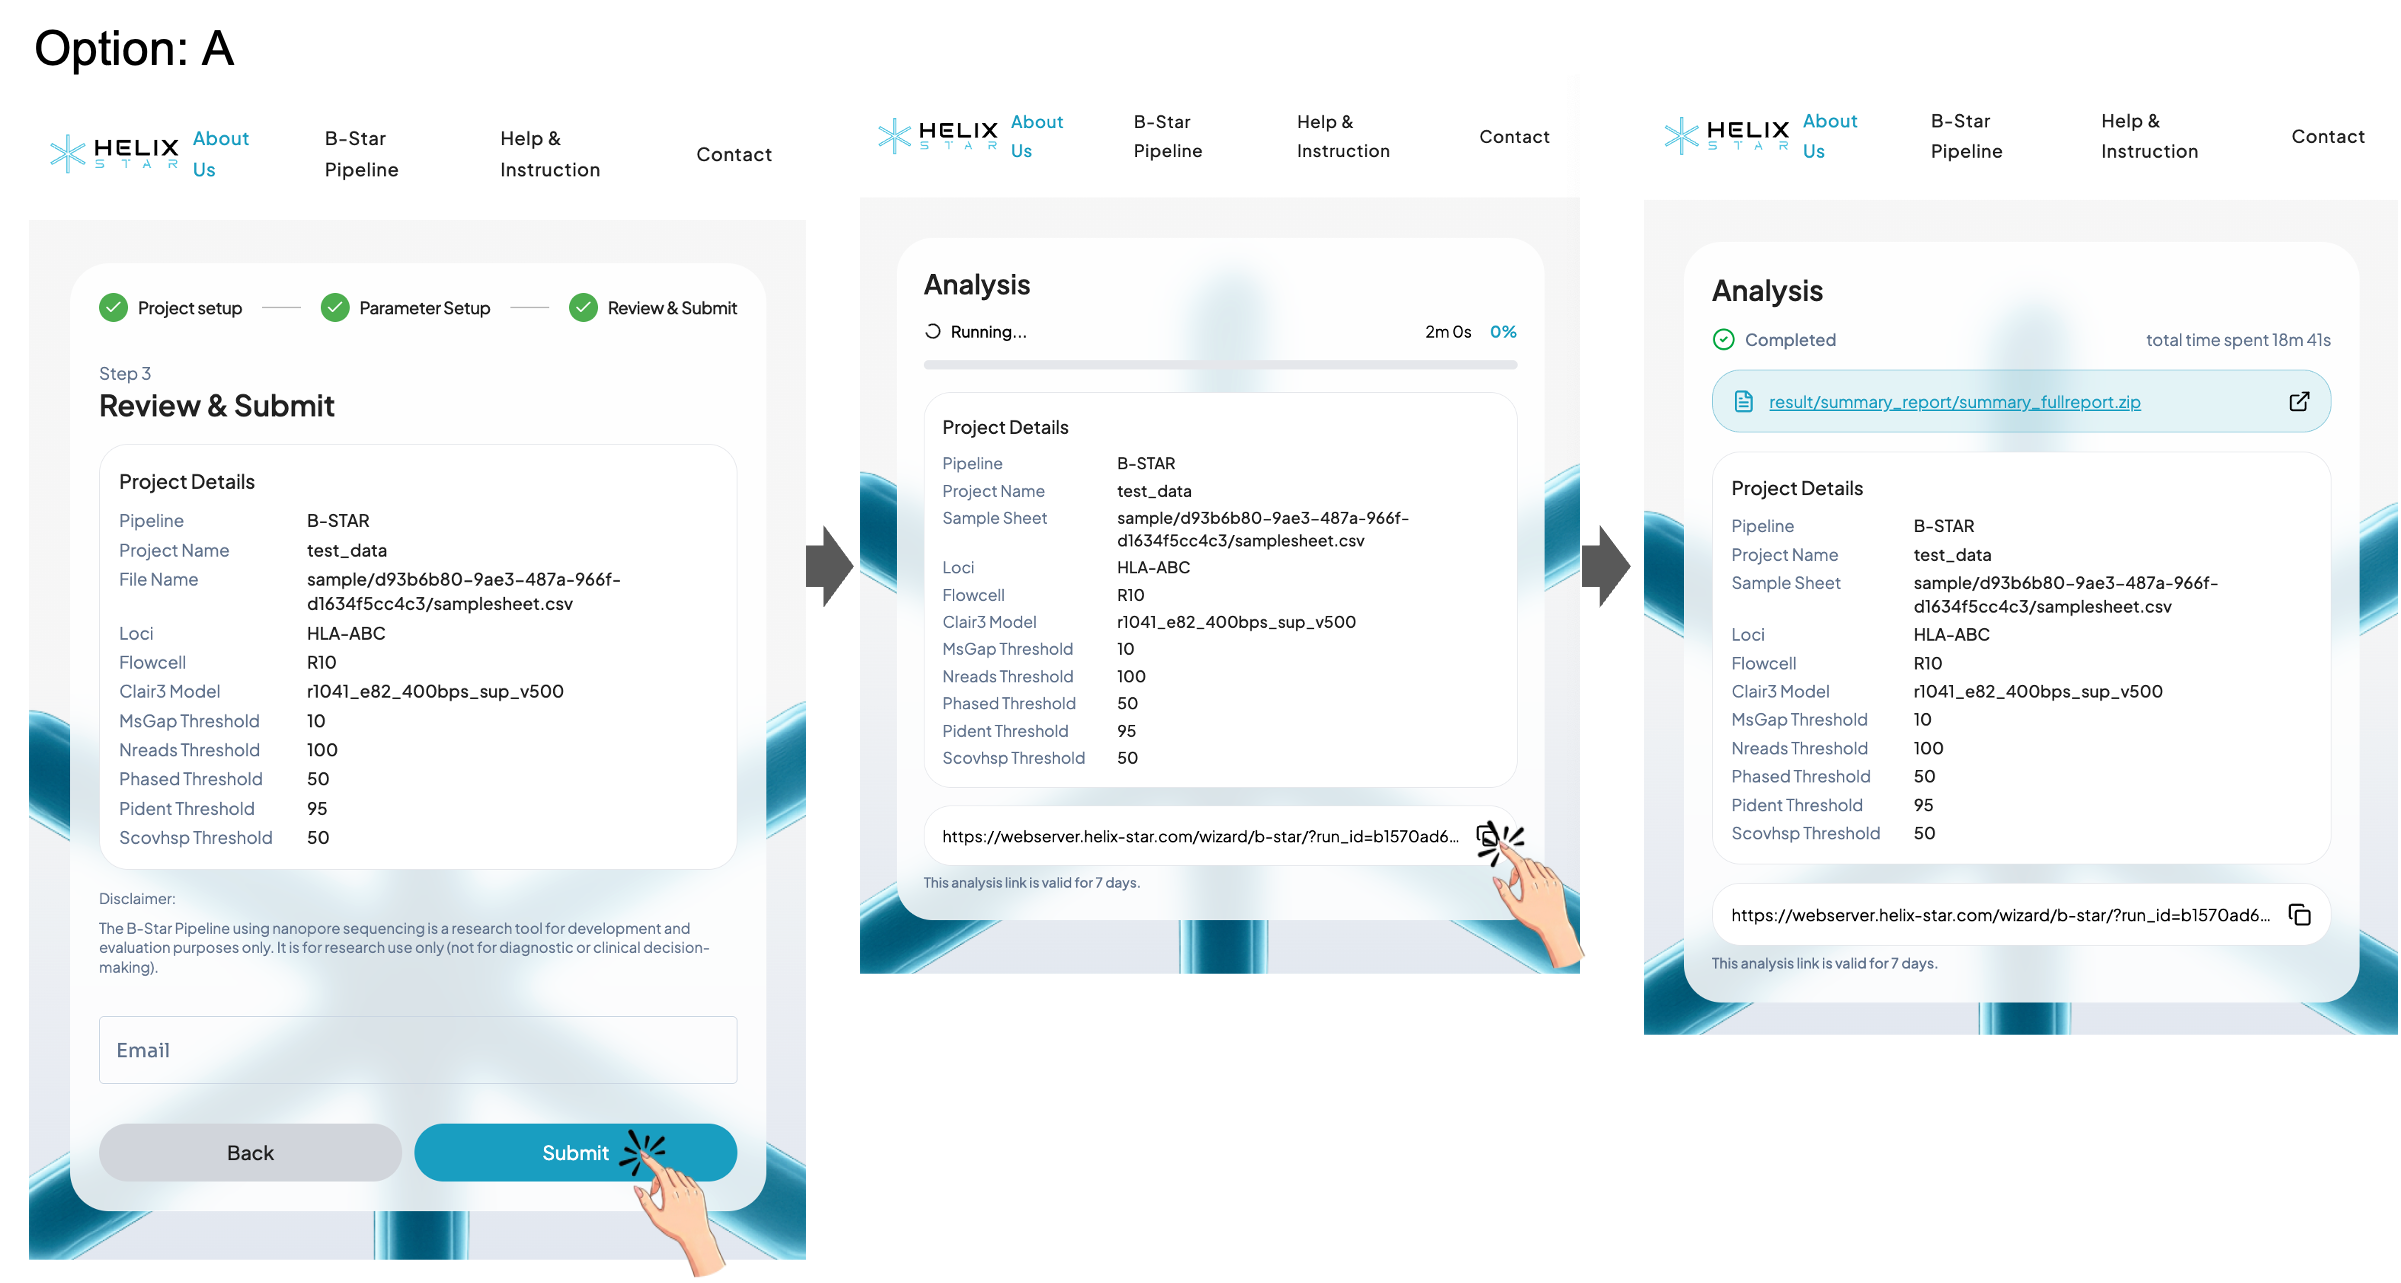
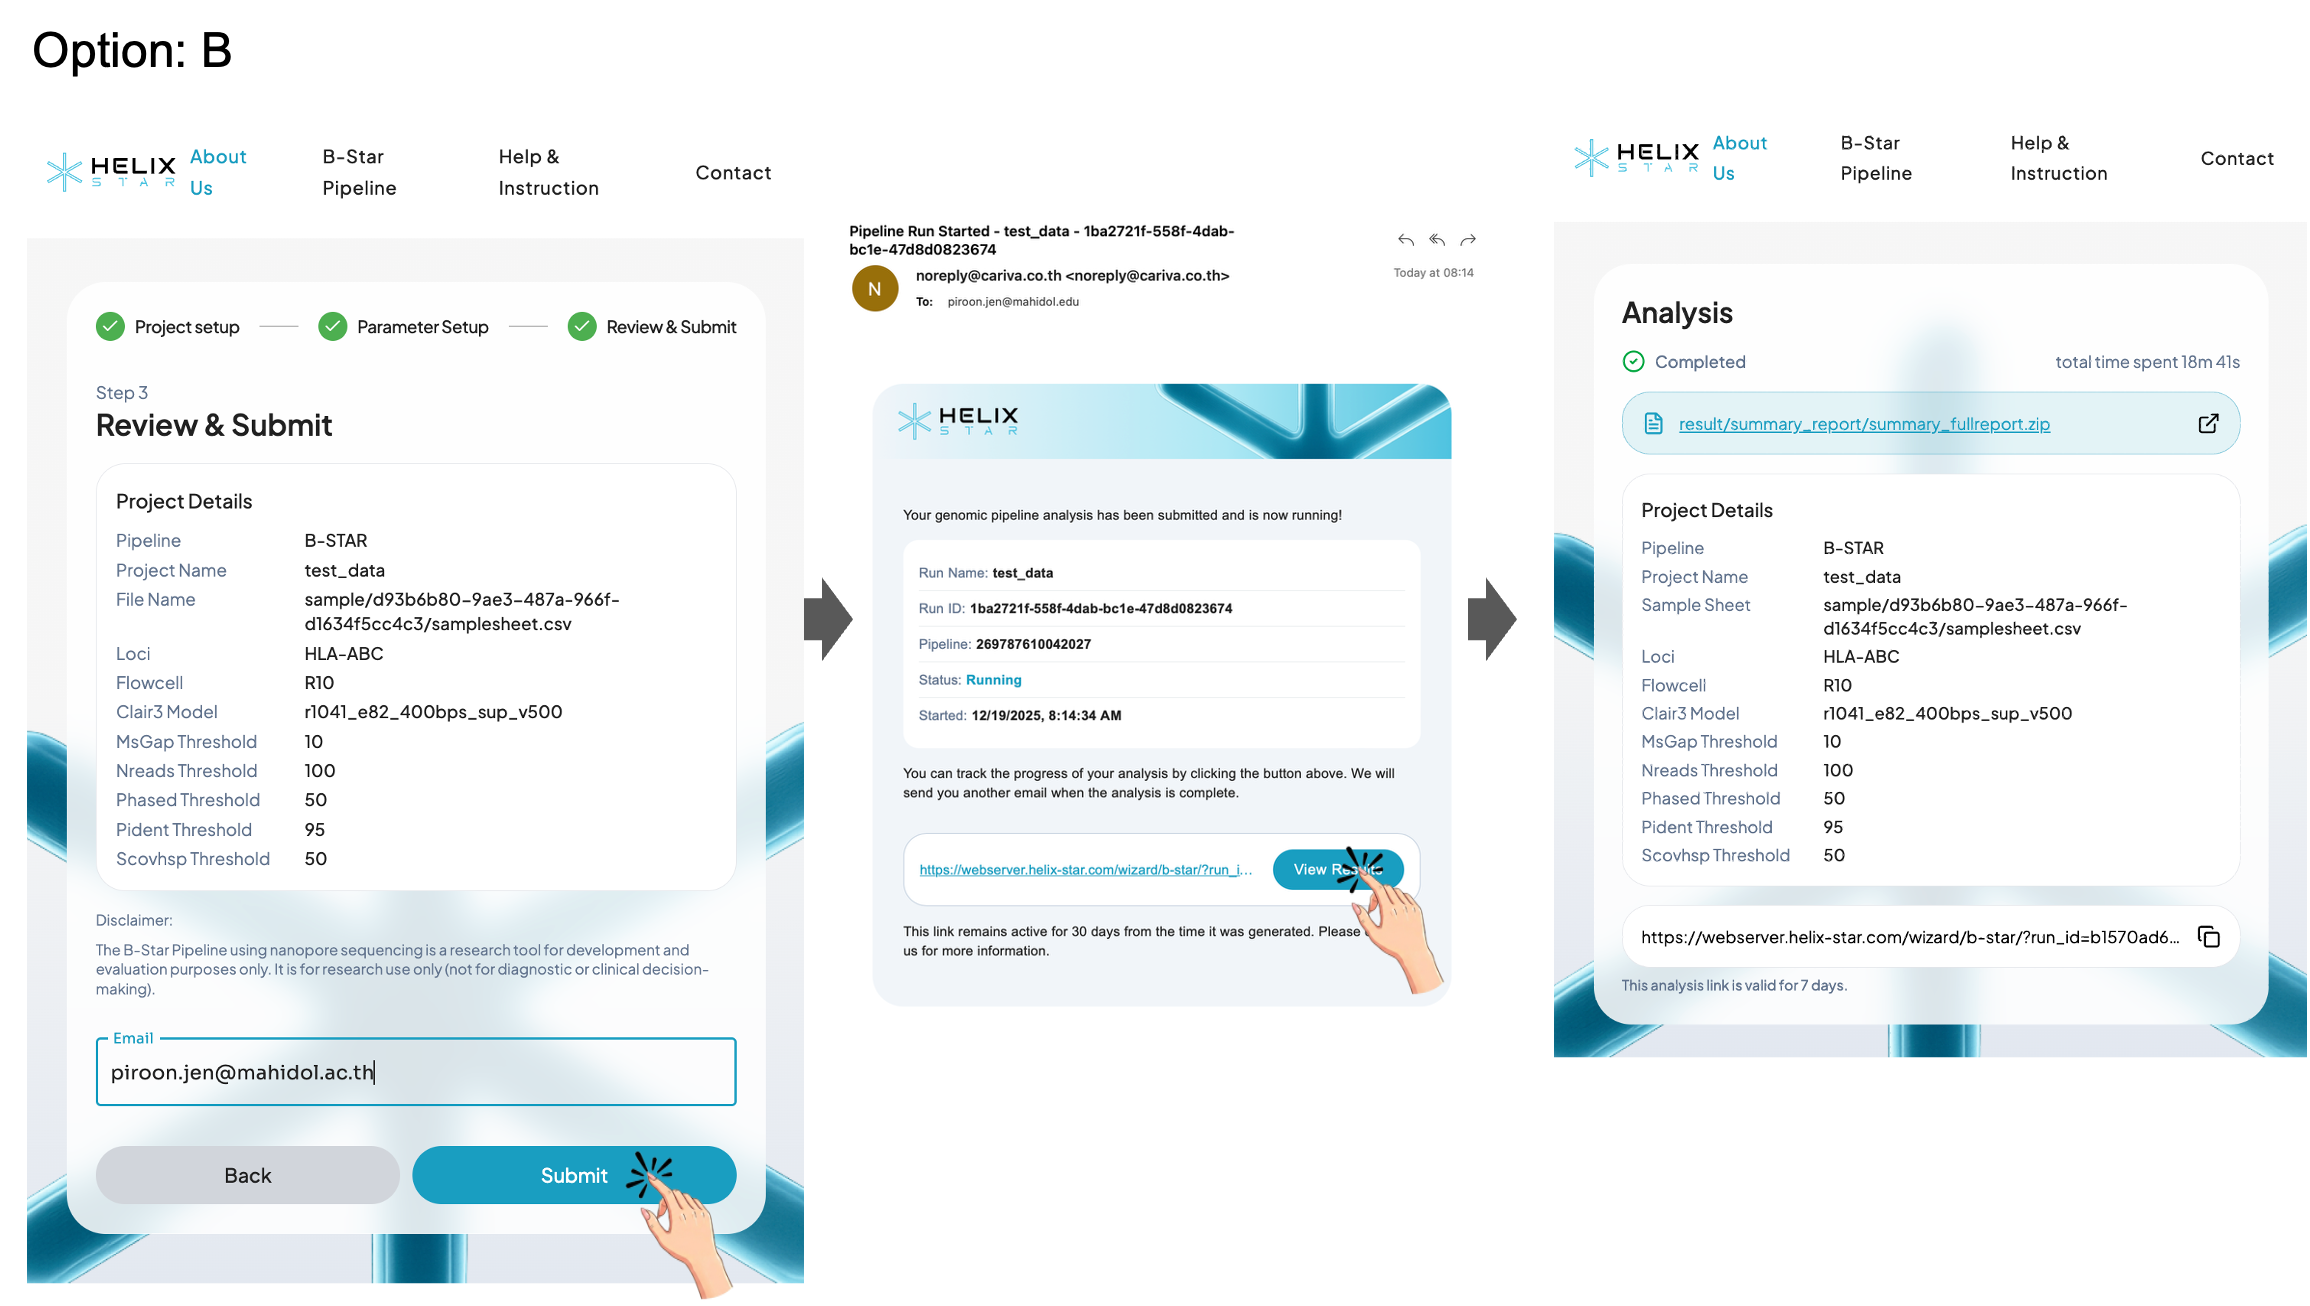
Step 3: Review & Submit
Review the submission details (project name, loci, flowcell, Clair3 model, and thresholds), then click Submit to start the run.
Option A: Without email
Users can wait for completion on the same page or copy the analysis link and save it as a browser bookmark or in their notes to revisit the results later. Please make sure to save the analysis link before leaving or closing this page. Without it, you may not be able to return to the results. This analysis link is valid for 7 days.
Option B: With email
Enter an email address to receive the analysis link in your inbox, then use that link later to revisit and download the results. This analysis link is valid for 7 days.
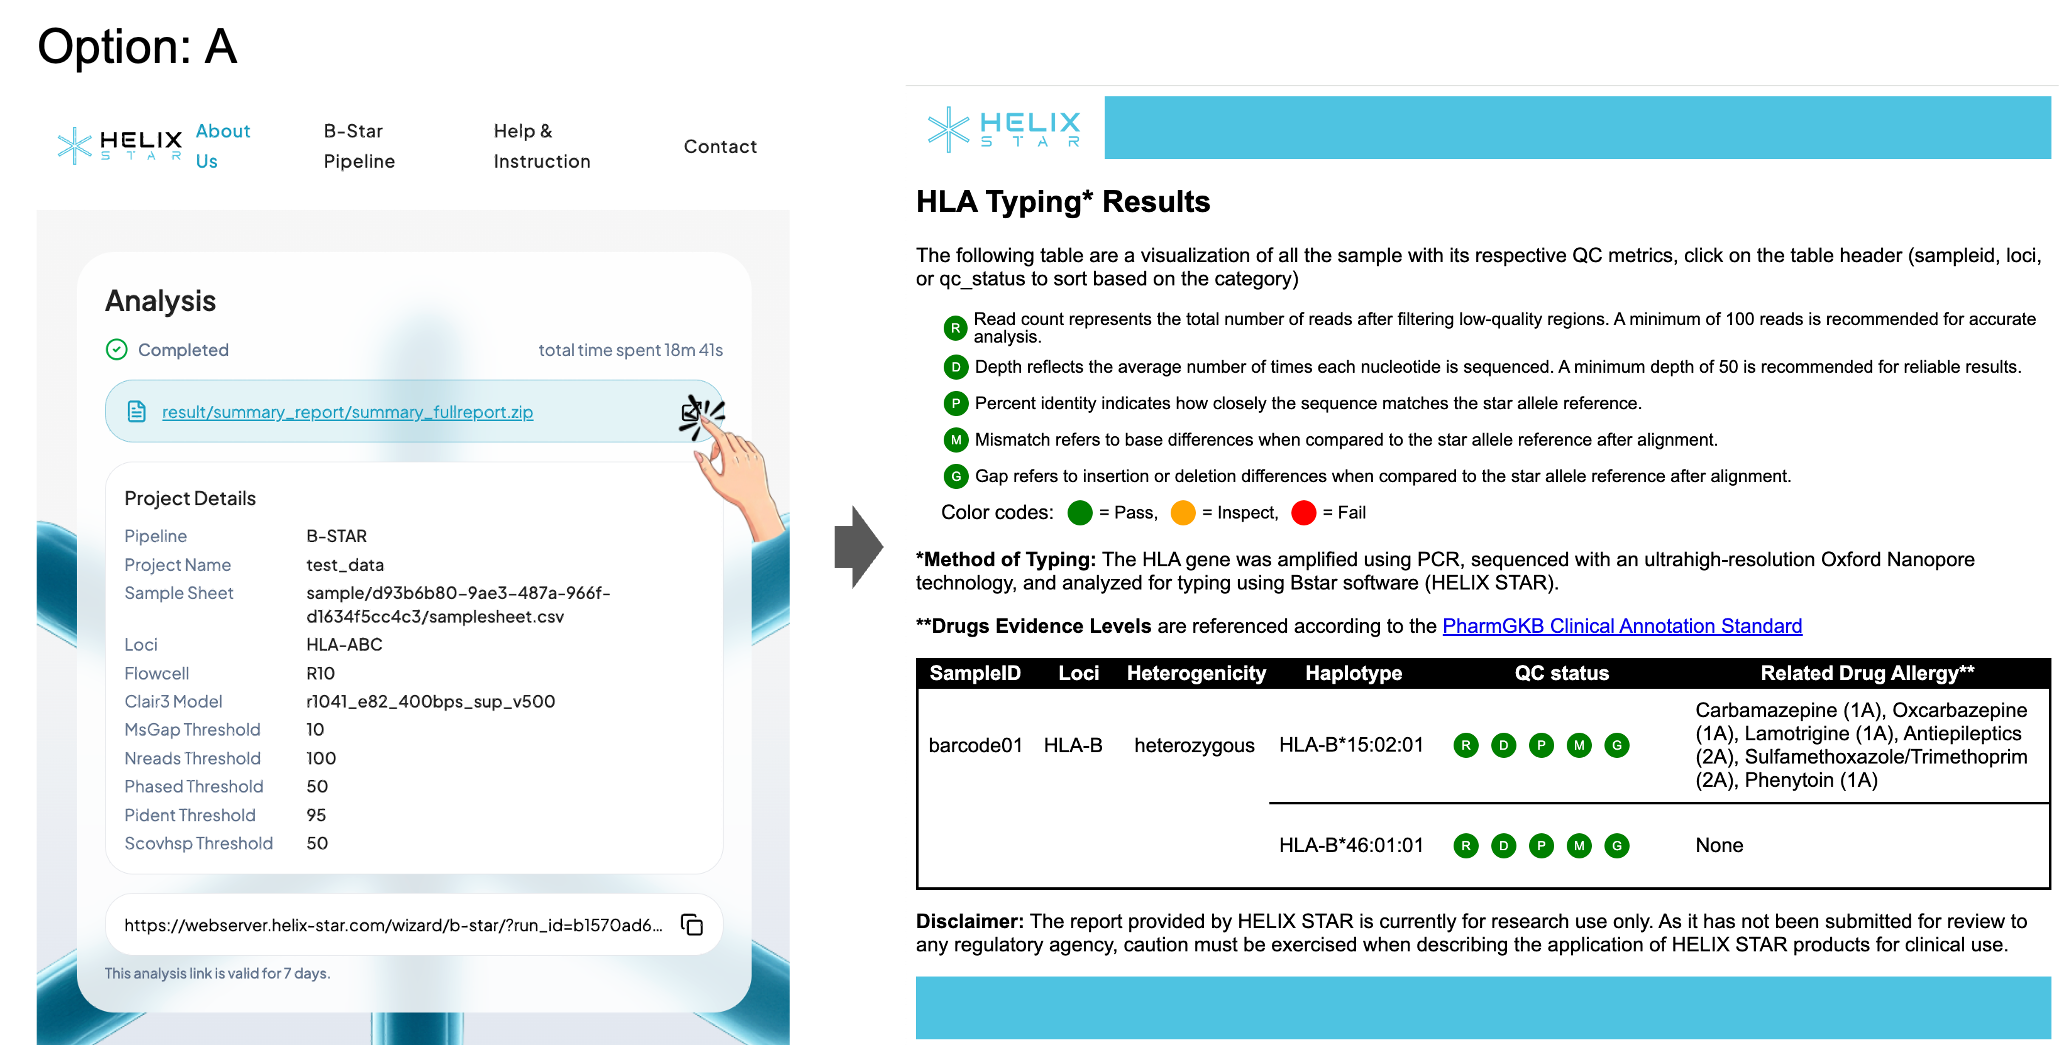
Report description
On the Analysis results page, a successful run is shown with the status Completed and the total time spent. Users can access the report in two ways:
Option A: View the HTML report in the browser
Click the External Link icon on the right side of the result link to open the HTML report in a new tab for an interactive, formatted view of the HLA typing results.
Option B: Download the full result package (.zip)
Click the result .zip link to download and save the output to your computer. After extracting the file, open the report files (e.g., summary_report_final.html, summary_report_final.txt, and summary_fullreport.txt) to review the results offline.
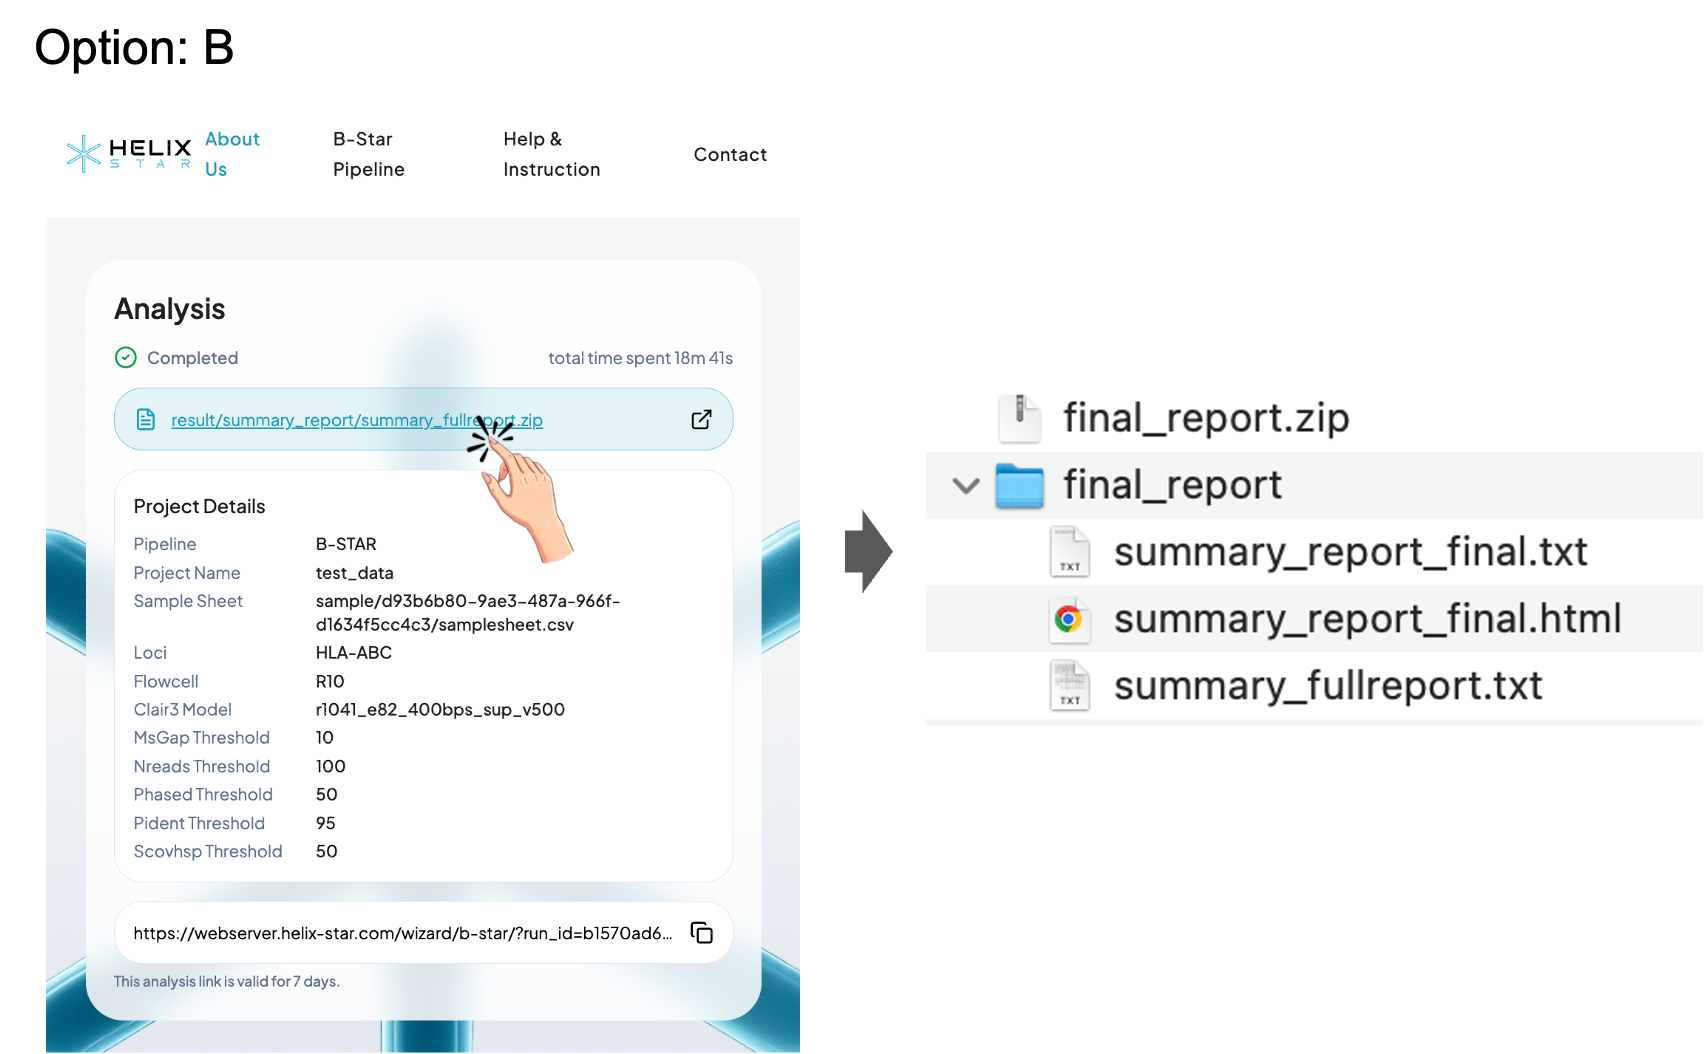
B-Star Pipeline Output Files Overview
1) summary_report_final.html: Interactive summary report (recommended for viewing)
The HTML summary report shows an HLA Typing Results table for your samples. Each sample row reports the detected HLA allele(s) (haplotypes) and a quick QC status to help you judge whether the result is reliable. The QC status is represented by five indicators:
- R (Read count): total reads after filtering low-quality regions (recommended ≥ 100)
- D (Depth): average sequencing depth across the locus (recommended ≥ 50)
- P (Percent identity): how closely the sequence matches the reference allele (recommended ≥ 95%)
- M (Mismatch): number of base differences vs. the reference after alignment (recommended ≤ 0)
- G (Gap): insertion/deletion differences vs. the reference after alignment (recommended ≤ 0)
Each indicator is color-coded (Pass / Inspect / Fail). If QC is not passing, the sample may need more reads, better basecalling, or reprocessing before trusting the allele call. The table also lists drug–allele associations ("Related Drug Allergy") based on PharmGKB evidence.
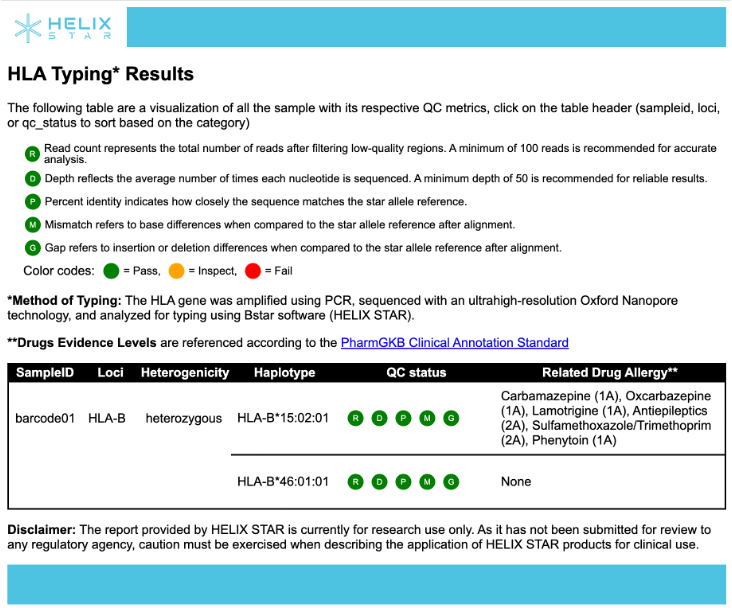
Table columns (Name and description)
| Name | Description | Example |
|---|---|---|
| SAMPLEID | Unique identifier for the sample (often derived from barcode or file name). | barcode01 |
| LOCI | The HLA locus analyzed (e.g., HLA-A, HLA-B, HLA-C). | HLA-B |
| HETEROGENICITY | Zygosity at the locus (e.g., heterozygous or homozygous) based on the allele calls. | heterozygous |
| HAPLOTYPE | The reported HLA star allele call for the locus (one allele per row/line in the table). | HLA-B*15:02:01 |
| QC STATUS | Summary QC indicators (R, D, P, M, G) showing whether read count, depth, identity, mismatch, and gaps meet recommended thresholds. | See color code |
| VIEW | Click to visualize IGV | - |
| CONSENSUS | Click to save consensus sequence | - |
| RELATED DRUG ALLERGY | Drugs associated with the reported HLA allele(s), referenced from PharmGKB (typically shown with evidence levels). | carbamazepine (1A), oxcarbazepine (1A) |
2) summary_report_final.txt: Compact TSV summary (easy to import into Excel/R/Python)
This is a tab-separated summary file designed for quick downstream use. It provides one concise line per sample/locus with the key calls: haplotype 1 and haplotype 2, their pass/fail status, heterogenicity, plus the related drug names and evidence levels. Use this file when you want a clean "final results table" without extra QC details.
Columns in TXT format
| Name | Description | Example |
|---|---|---|
| sample | Sample identifier | Sample01 |
| gene | HLA locus | HLA-A |
| hap1_star | Haplotype 1 star-allele call | A*02:01:01:01 |
| hap1_status | QC status for haplotype 1 | Pass |
| hap2_star | Haplotype 2 star-allele call | A*24:02:01:01 |
| hap2_status | QC status for haplotype 2 | Pass |
| heterogenicity | Whether sample is heterozygous | Het |
| overall_status | Combined QC status | Pass |
| related_drug_1 | First associated drug (if any) | Abacavir |
| evidence_level_1 | PharmGKB evidence level for drug 1 | 1A |
| related_drug_2 | Second associated drug (if any) | Carbamazepine |
| evidence_level_2 | PharmGKB evidence level for drug 2 | 1A |
| timestamp | Analysis completion time | 2024-01-15 10:30:00 |
3) summary_fullreport.txt: Full TSV report (QC + variant/annotation details)
This is the most detailed output (tab-separated) intended for QC review, troubleshooting, and auditing. It contains extensive per-haplotype fields such as depth and depthQC, IPD accession and star allele, alignment metrics (percent identity, mismatch, gaps, bitscore/evalue), candidate star lists, plus additional fields for intronic/exonic variant summaries and QC flags (e.g., overallQC, ann_status). It also includes read QC summaries (original/trimmed read length, quality, read counts) and drug/evidence fields, and records the thresholds used (r_thresh, d_thresh, p_thresh, m_thresh, g_thresh) at the end of each row. When the HTML summary report shows "Inspect" or "Fail," this full report should be used to identify which QC metric(s) did not meet the thresholds and to support troubleshooting.
| Name | Description | Example |
|---|---|---|
| sample | Sample identifier | Sample01 |
| gene | HLA locus analyzed | HLA-A |
| hap1_ipd_accession | IPD-IMGT/HLA accession for haplotype 1 | HLA00001 |
| hap1_star | Star-allele call for haplotype 1 | A*02:01:01:01 |
| hap1_depth | Average depth for haplotype 1 | 85.2 |
| hap1_depthQC | Depth QC status | Pass |
| hap1_pident | Percent identity for haplotype 1 | 99.8 |
| hap1_pidentQC | Percent identity QC status | Pass |
| hap1_mismatch | Number of mismatches | 0 |
| hap1_mismatchQC | Mismatch QC status | Pass |
| hap1_gaps | Number of gaps | 0 |
| hap1_gapsQC | Gaps QC status | Pass |
| hap1_bitscore | BLAST bitscore | 5420 |
| hap1_evalue | BLAST e-value | 0.0 |
| hap1_candidates | List of candidate alleles | A*02:01:01:01,A*02:01:01:02 |
| hap2_ipd_accession | IPD-IMGT/HLA accession for haplotype 2 | HLA00005 |
| hap2_star | Star-allele call for haplotype 2 | A*24:02:01:01 |
| hap2_depth | Average depth for haplotype 2 | 78.5 |
| hap2_depthQC | Depth QC status | Pass |
| hap2_pident | Percent identity for haplotype 2 | 99.5 |
| hap2_pidentQC | Percent identity QC status | Pass |
| hap2_mismatch | Number of mismatches | 1 |
| hap2_mismatchQC | Mismatch QC status | Inspect |
| hap2_gaps | Number of gaps | 0 |
| hap2_gapsQC | Gaps QC status | Pass |
| hap2_bitscore | BLAST bitscore | 5380 |
| hap2_evalue | BLAST e-value | 0.0 |
| hap2_candidates | List of candidate alleles | A*24:02:01:01 |
| heterogenicity | Heterozygous status | Het |
| overall_status | Combined overall QC | Inspect |
| ann_status | Annotation status | Complete |
| intronic_variants | Summary of intronic variants | 2 SNPs |
| exonic_variants | Summary of exonic variants | 0 |
| read_count_original | Original read count | 15420 |
| read_count_trimmed | Read count after trimming | 14850 |
| read_length_mean | Mean read length | 4520 |
| read_quality_mean | Mean read quality (Q-score) | 18.5 |
| related_drug_1 | First associated drug | Abacavir |
| evidence_level_1 | Evidence level for drug 1 | 1A |
| related_drug_2 | Second associated drug | — |
| evidence_level_2 | Evidence level for drug 2 | — |
| r_thresh | Read count threshold used | 100 |
| d_thresh | Depth threshold used | 50 |
| p_thresh | Percent identity threshold used | 95 |
| m_thresh | Mismatch threshold used | 0 |
| g_thresh | Gap threshold used | 0 |
| timestamp | Analysis timestamp | 2024-01-15 10:30:00 |